
These demos are provided freely simply for fun and for educational purposes. We hope they might be of use as teaching aids in vision / neuroscience classes. Please cite the creators of the demos if you use them (if not otherwise indicated all demos were made by Mark Lescroart). Some of these demos use pycortex, a python toolbox for MRI and fMRI visualization partly developed by lab members. Pycortex relies on WebGL, so most of the brain demos unfortunately can’t be viewed on iPhones, iPads, or in some browsers.
fMRI
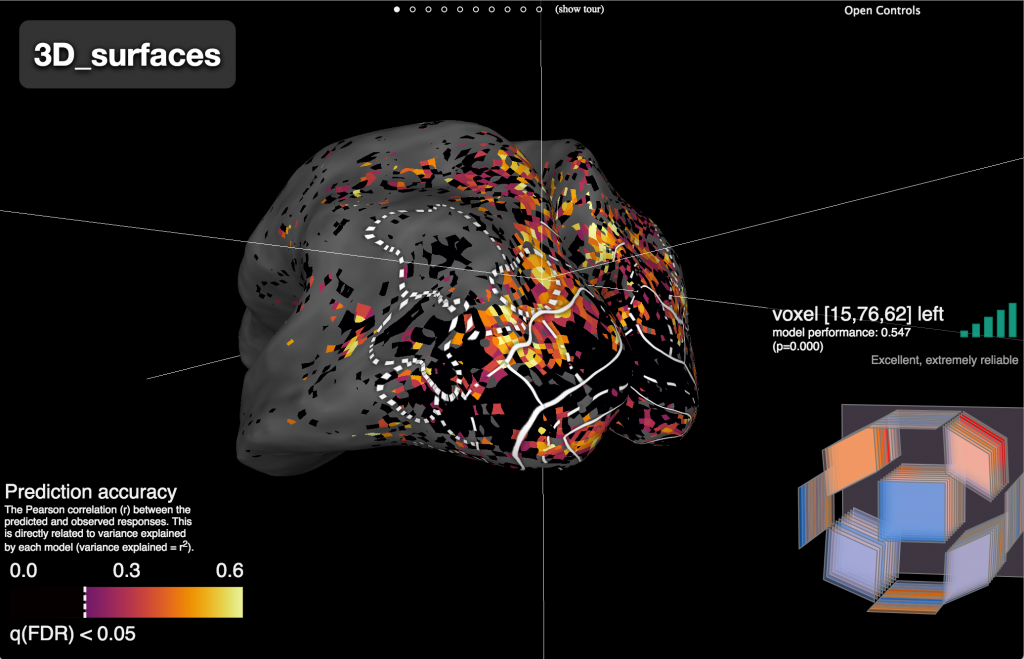
This interactive web site shows shows how the brain represents the structure of 3D visual scenes. This demo was created to convey the results in this paper.
![A brain, with the four lobes each highlighted in different colors. The occipital lobe (back part of the brain) is yellow, the parietal lobe (upper back part of the brain) is green, the temporal lobe (lateral part, near the ears) is blue, and the frontal lobe is red. The link leads to an interactive plot of the brain that can be manipulated in 3D, including expanding the cortical surface such that brain area deep in sulci is visible, as well as flattening out the surface of the brain so that all the cortex is visible at once. Major sulci and a few regions of interest are labeled in the interactive viewer.
[DISCLAIMER?]](http://piecesofmind.psyc.unr.edu/wp-content/uploads/2018/08/brainanatomy_viewer_still-1024x686.png)
This interactive web site shows the locations of various anatomical landmarks on the brain of a single subject. The four lobes are colored, and major sulci and gyri (valleys and bumps in the brain) are labeled.
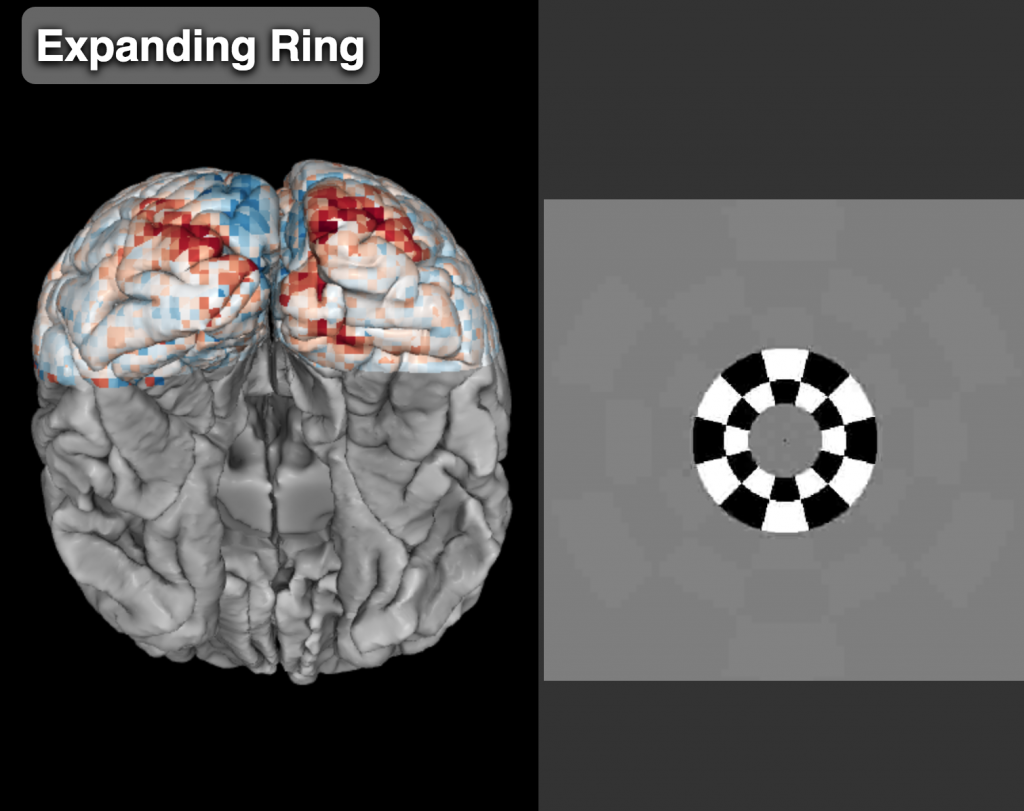
This interactive web site shows a demonstration of BOLD fMRI responses in the visual cortex to a retinotopic mapping stimulus. Red colors indicate greater-than-average responses. The responses move in a regular pattern that tracks the highest contrast locations in the visual stimulus. WARNING: The stimulus in this demonstration video may potentially trigger seizures for people with photosensitive epilepsy. Viewer discretion is advised.
This video demonstrates the functions of various brain areas by showing brain responses to a variety of visual and tactile stimuli. This video was submitted to the 2014 Vizzies. CAUTION: one of the stimuli shown in this video (from 1:20 to 1:45) flickers quickly, and may potentially trigger seizures for people with photosensitive epilepsy. Viewer discretion is advised.
This video provides a visualization of how echo planar imaging (EPI) scans are acquired in functional magnetic resonance imaging (fMRI) scanners. EPI scans are the most common type of fMRI scan used in human brain research. EPI scans do not capture images all at once like a camera or an X ray does. Instead, the scan measures how well the magnetic field in the brain matches a grating pattern. (More technically, the scanner measures the magnetic resonance at particular spatial frequencies). The more of these patterns (the more frequencies) are collected, the more clearly the image can be reconstructed. The panel at the top right shows the frequencies being collected during the course of a scan, the panel at the bottom left shows the accumulation of frequency information in frequency space (a.k.a. Fourier space), and the bottom right images shows a reconstruction of the brain based on the frequencies acquired up to a given time point. The brain slowly “comes into focus” throughout the scan.
Vision
This animation shows (approximately) the way the visual field is distorted as it is mapped to the visual cortex. Each dot is a single point in visual space.
This illusion shows how the boundaries of an object affect your perception of the 3D shape of the object. Notice how the number of bumps seem to change as the boundaries change, even though the shading is the same throughout! This shows that shading alone isn’t sufficient to tell you what is convex and what is concave – the final 3D percept depends on BOTH the shading and the boundaries of an object.